Chapter 5 Testing forecast accuracy
Once you have found a set of possible forecast models, you are ready to compare forecasts from a variety of models and choose a forecast model.
To quantify the forecast performance, we need to create forecasts for data that we have so that we can compare the forecast to actual data. There are two approaches to this.
5.0.1 Training set/test set
One approach is to ‘hold out’ some of your data as the test data and did not use it at all in your fitting. To measure the forecast performance, you fit to your training data and test the forecast against the data in the test set. This is the approach that Stergiou and Christou used.
Stergiou and Christou used 1964-1987 as their training data and tested their forecasts against 1988 and 1989.
Forecast versus actual
We will fit to the training data and make a forecast for the test data. We can then compare the forecast to the actual values in the test data.
fit1 <- forecast::auto.arima(traindat)
fr <- forecast::forecast(fit1, h=2)
fr
## Point Forecast Lo 80 Hi 80 Lo 95 Hi 95
## 1988 10.03216 9.789577 10.27475 9.661160 10.40317
## 1989 10.09625 9.832489 10.36001 9.692861 10.49964Plot the forecast and compare to the actual values in 1988 and 1989.
plot(fr)
points(testdat, pch=2, col="red")
legend("topleft", c("forecast","actual"), pch=c(20,2), col=c("blue","red"))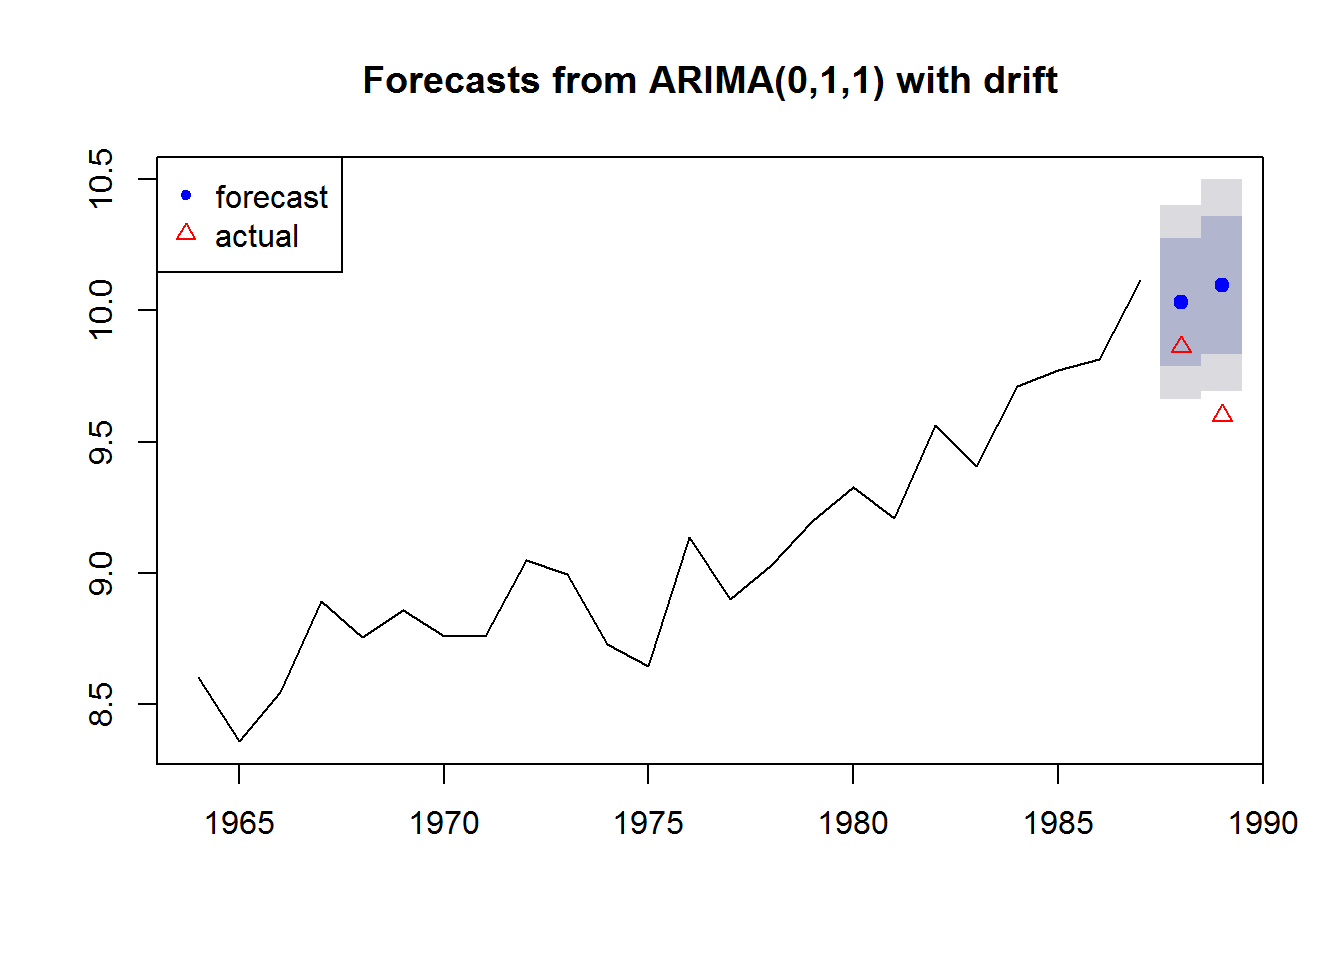
5.0.2 Cross-Validation
An alternate approach to is to use cross-validation. This approach uses windows or shorter segments of the whole time series to make a series of single forecasts. We can use either a variable length or a fixed length window.
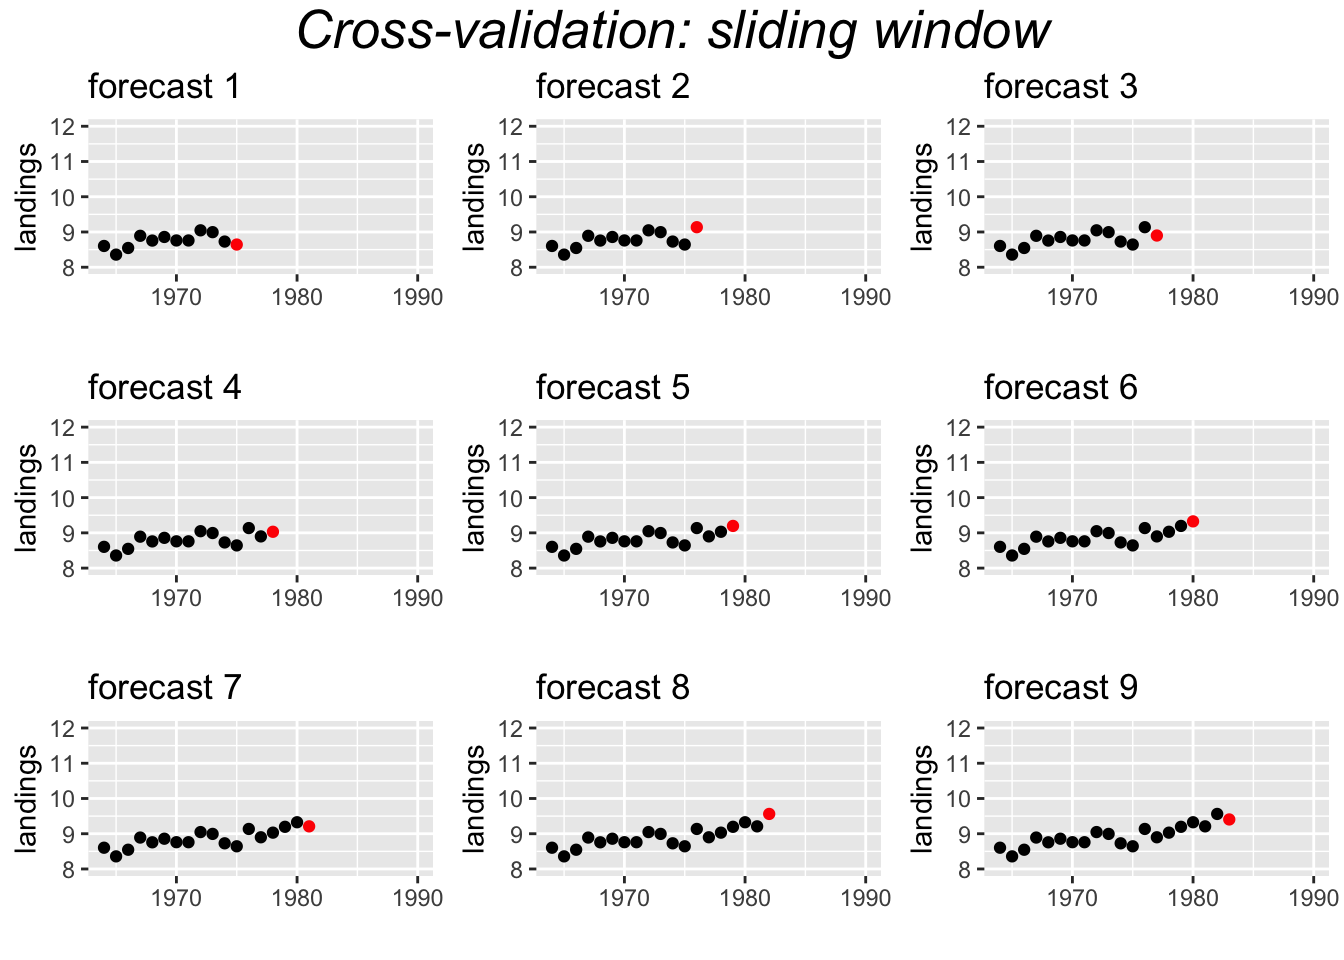
Variable window
For the variable length window approach applied to the Anchovy time series, we would fit the model 1964-1973 and forecast 1974, then 1964-1974 and forecast 1975, then 1964-1975 and forecast 1976, and continue up to 1964-1988 and forecast 1989. This would create 16 forecasts which we would compare to the actual landings. The window is ‘variable’ because the length of the time series used for fitting the model, keeps increasing by 1.
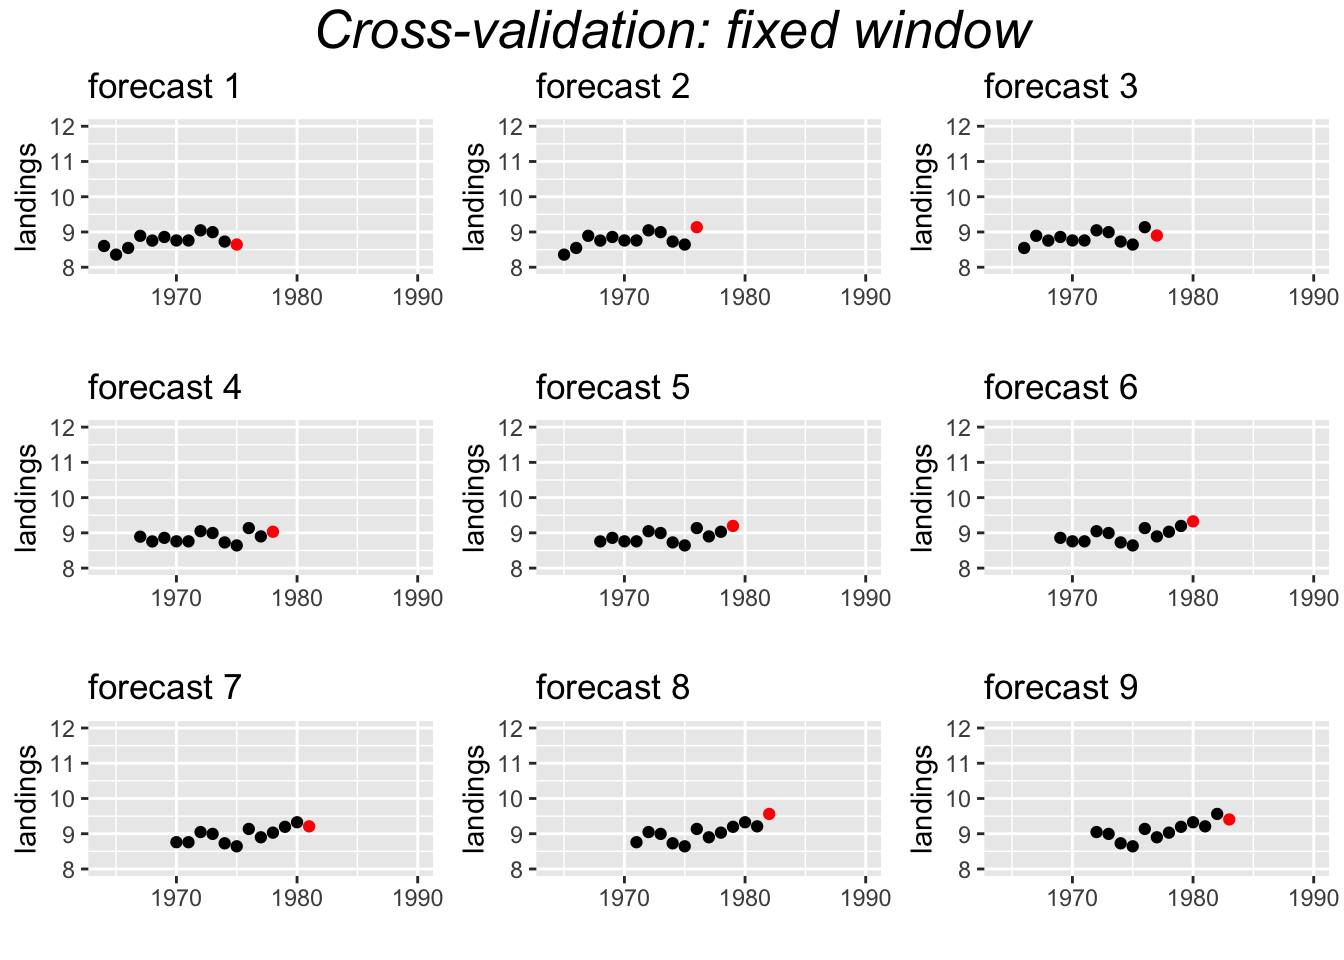
Fixed window
Another approach uses a fixed window. For example, a 10-year window.
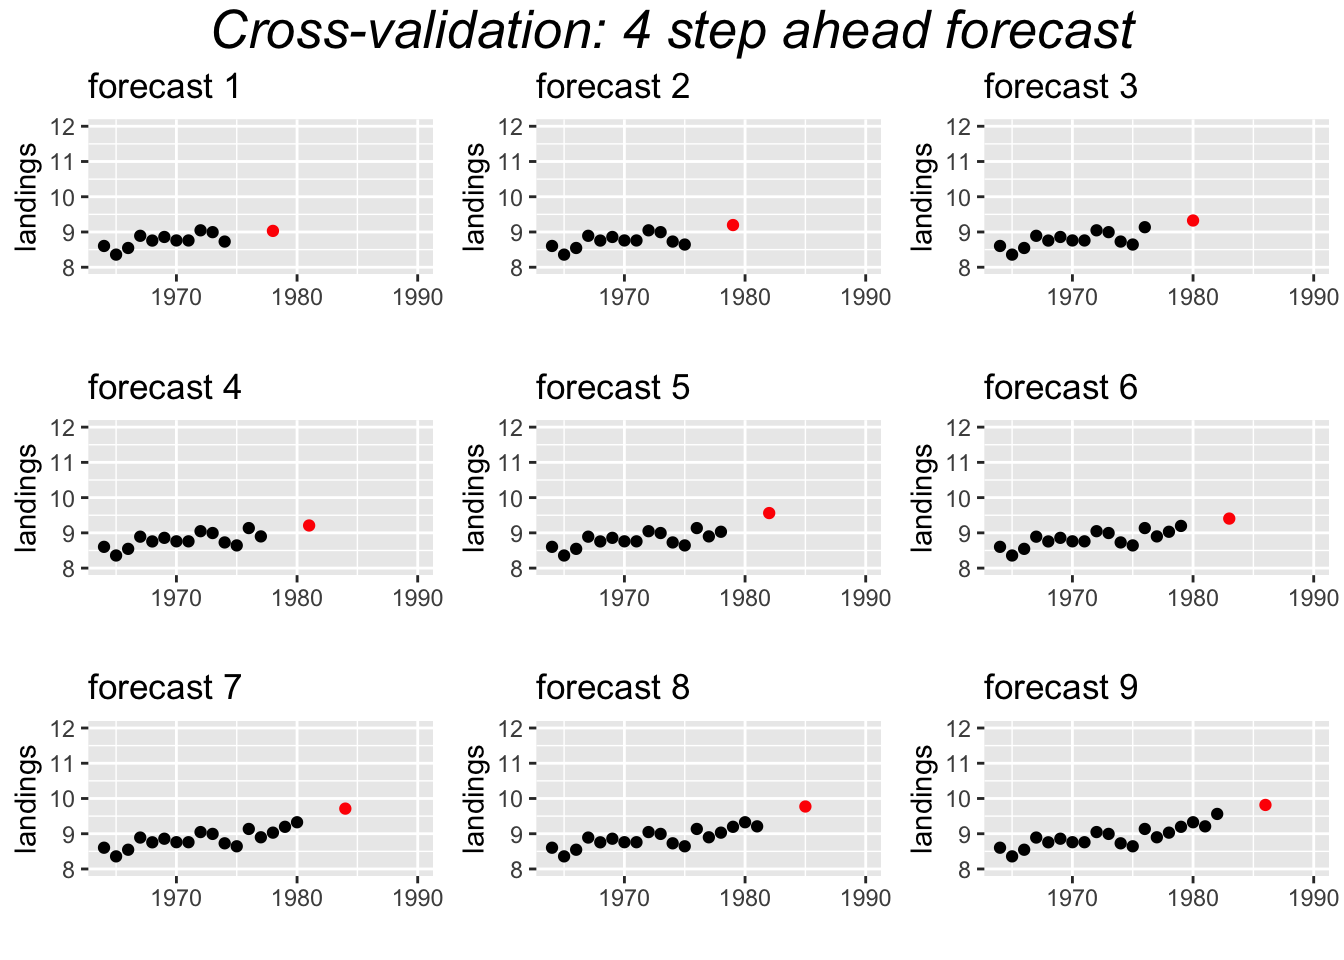
Cross-validation farther in future
Sometimes it makes more sense to test the performance for forecasts that are farther in the future. For example, if the data from your catch surveys takes some time to process, then you might need to make forecasts that are farther than 1 year from your last data point.
In that case, there is a gap between your training data and your test data point.